Where U.S. Ophthalmologists Practice: A State-by-State Map of Eye Care Coverage
We mapped the practicing ophthalmologists in our directory across all 50 states and DC. The result: a 15x spread in eye-care density between the best- and worst-served states—with surprises at both ends.
Why we built this
At Kerbside Health, we’re building the most comprehensive and accurate directory of eye care providers in America. While we keep chipping away at coverage state by state, our team pulled some directional numbers from our growing dataset that we thought were genuinely interesting — and worth sharing.
What follows is a snapshot of every practicing ophthalmologist in the Kerbside directory, mapped to a verified primary practice state and weighted by population so you can compare apples to apples. The map reveals where eye care is concentrated, where it’s stretched thin, and a few patterns that probably aren’t what you’d expect.
What stood out
Three things jumped out when we ran the numbers:
- A 15× spread. Massachusetts has 5.30 ophthalmologists per 100,000 residents. Wyoming has 0.34. That’s a wider per-capita gap than most patients searching for an eye doctor near them would guess.
- Coastal, blue-leaning states cluster at the top. Massachusetts, Maryland, Connecticut, Hawaii, and Utah lead per capita. New Hampshire and Oregon round out the top seven.
- The “California paradox.” California has 639 ophthalmologists in our directory — by far the most of any state in absolute terms. But its population is so large that per-capita coverage (1.62 per 100k) lands it near the bottom of the rankings.
The five most-covered states
- Massachusetts — 370 providers · 5.30 per 100k
- Maryland — 322 providers · 5.22 per 100k
- Connecticut — 167 providers · 4.62 per 100k
- Hawaii — 61 providers · 4.24 per 100k
- Utah — 143 providers · 4.23 per 100k
The five least-covered states
A note before reading these: low coverage in our directory doesn’t necessarily mean low coverage in the state itself. Our directory is still growing, and rural states are typically the last places where any provider directory reaches saturation. We’re actively verifying and adding more ophthalmologists in these markets.
- Wyoming — 2 providers · 0.34 per 100k
- West Virginia — 24 providers · 1.35 per 100k
- North Dakota — 12 providers · 1.54 per 100k
- Vermont — 10 providers · 1.55 per 100k
- California — 639 providers · 1.62 per 100k
Why density isn’t the whole story
Per-capita coverage tells you how thinly providers are spread across a state’s population, but it doesn’t tell you who you can actually see for your specific eye condition. Subspecialty mix matters enormously: a state with strong general ophthalmology coverage may still be underserved for glaucoma specialists or retina and vitreous surgeons.
Population density also reshapes how patients experience access. California’s 639 ophthalmologists are heavily concentrated in metro areas like Los Angeles, San Francisco, and San Diego — which means urban patients may have ample choice while rural California patients face long drives. The same dynamic applies in Texas (514 providers, 1.71 per 100k) and Florida (585 providers, 2.63 per 100k).
And the conditions driving most ophthalmology visits — cataracts, glaucoma, diabetic retinopathy, and age-related macular degeneration (AMD) — affect different age and demographic mixes that don’t always line up with where ophthalmologists practice. A state that screens well for cataract surgery may be underserved for retinal disease.
What we’ll update next
Our directory grows every week as we add and verify more providers, so this map is a snapshot — not a final answer. Future Kerbside Insights pieces will dig into subspecialty distribution by state, metro-level density, and how the picture changes year over year. If you want to be notified when we publish the next one, the easiest way is to bookmark /insights or follow us on social.
And if you’re a patient looking for an ophthalmologist today, the most useful starting point is your state’s provider directory — every state shown above is one click away.
Use this map
Journalists, researchers, and clinicians are welcome to embed this map on their own site. Click the “Use this graphic” button next to the figure above for ready-to-paste HTML, Markdown, or image-URL embed code — every format includes proper attribution back to this article. No permission needed; we just ask that you keep the source line intact.
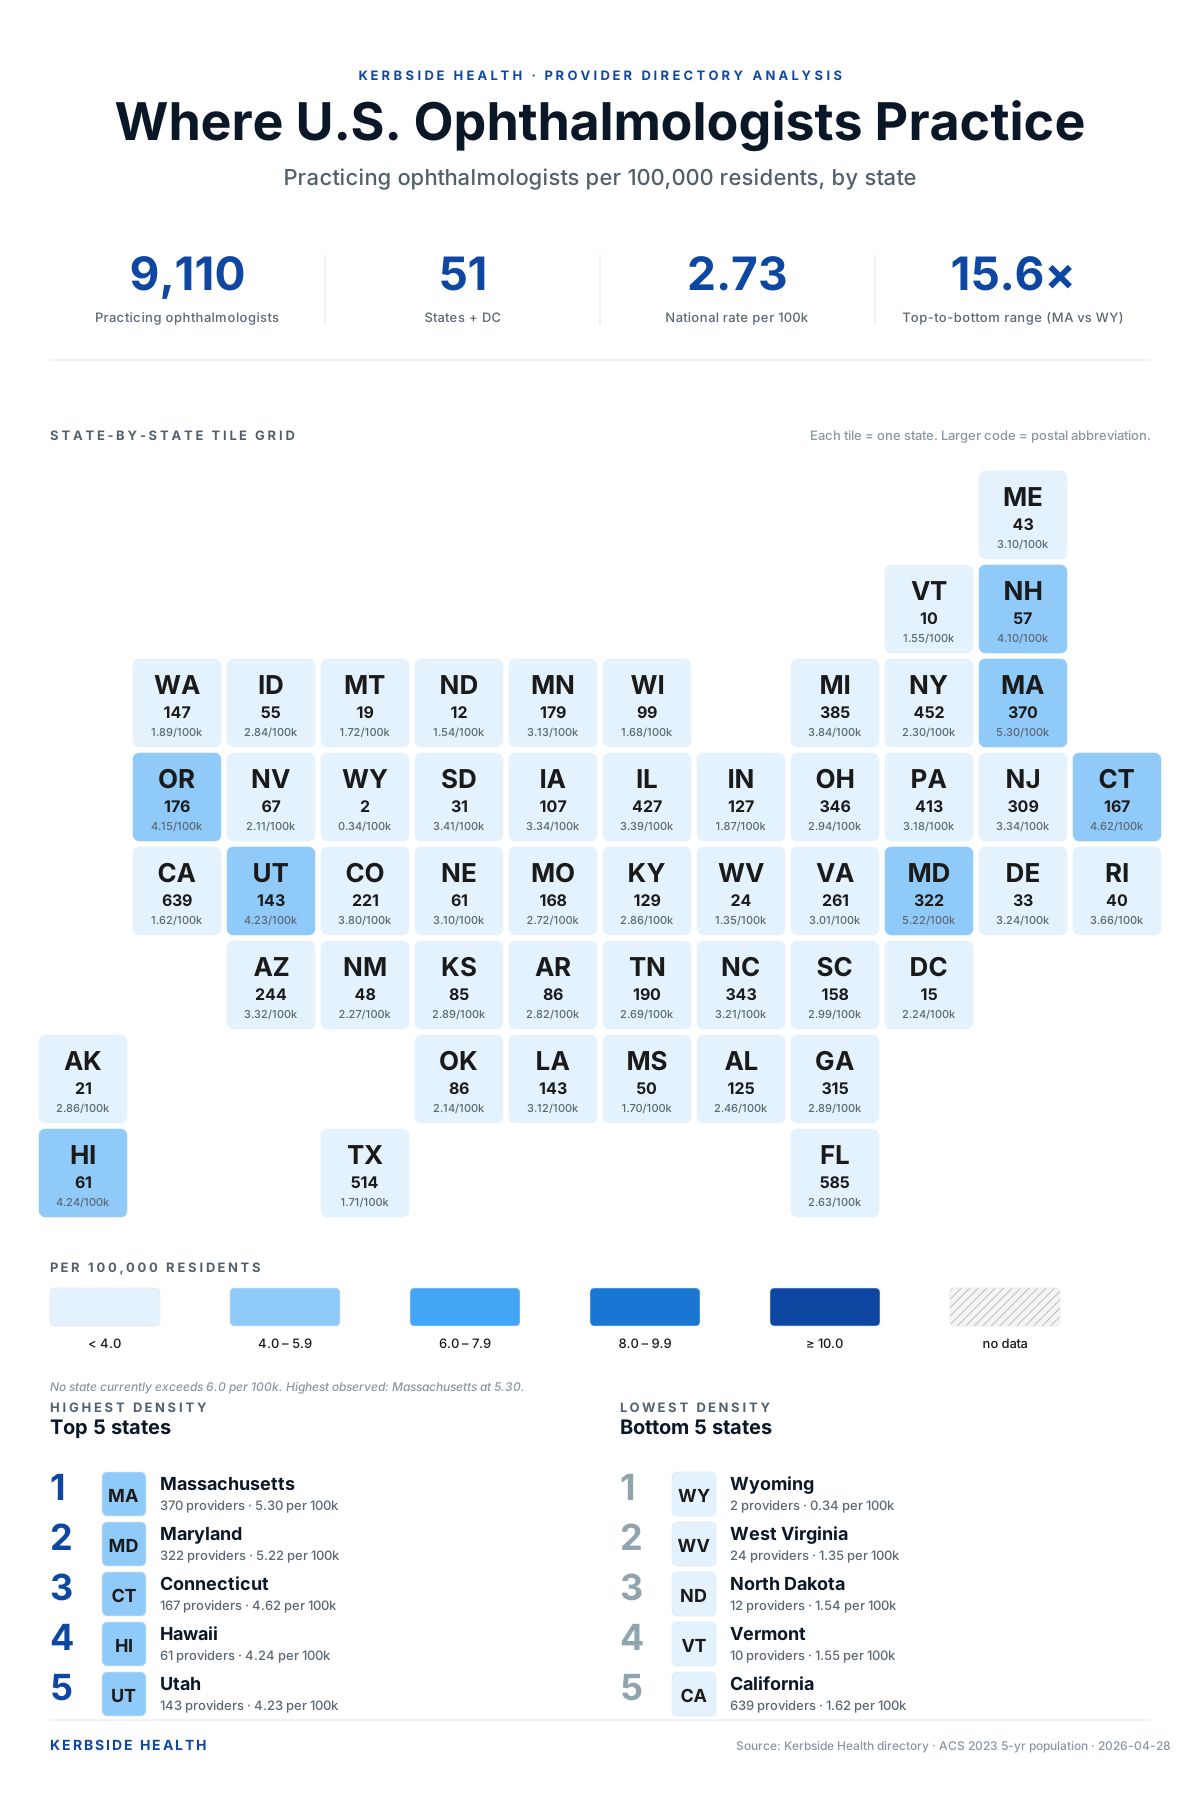
Kerbside Health directory · ACS 2023 5-year state population estimates
Use this graphic
Paste into any blog or CMS:
Sources
- U.S. Census Bureau, American Community Survey 5-Year Estimates (2023), Table B01003 (accessed Apr 29, 2026)
- Kerbside Health Provider Directory (accessed Apr 29, 2026)